Month by month
Money in. And what was left.
Same twelve months, side by side. The blue bar is what you billed. The green one is what you still had after paying for it all.
Now look at October. That month lost $6,000 on a job where the decking came off rotten and nobody put the extra work on the bill. On this page you can see it. In a shoebox you find out in February.
Figures from the demo workspace, not a customer's books.
Every job, not just the good ones
Eight jobs. Two of them lost money.
Revenue, what it cost to do, the overheads it carried, and the margin left: one row per job, and the two that went backwards are in red where you can see them.
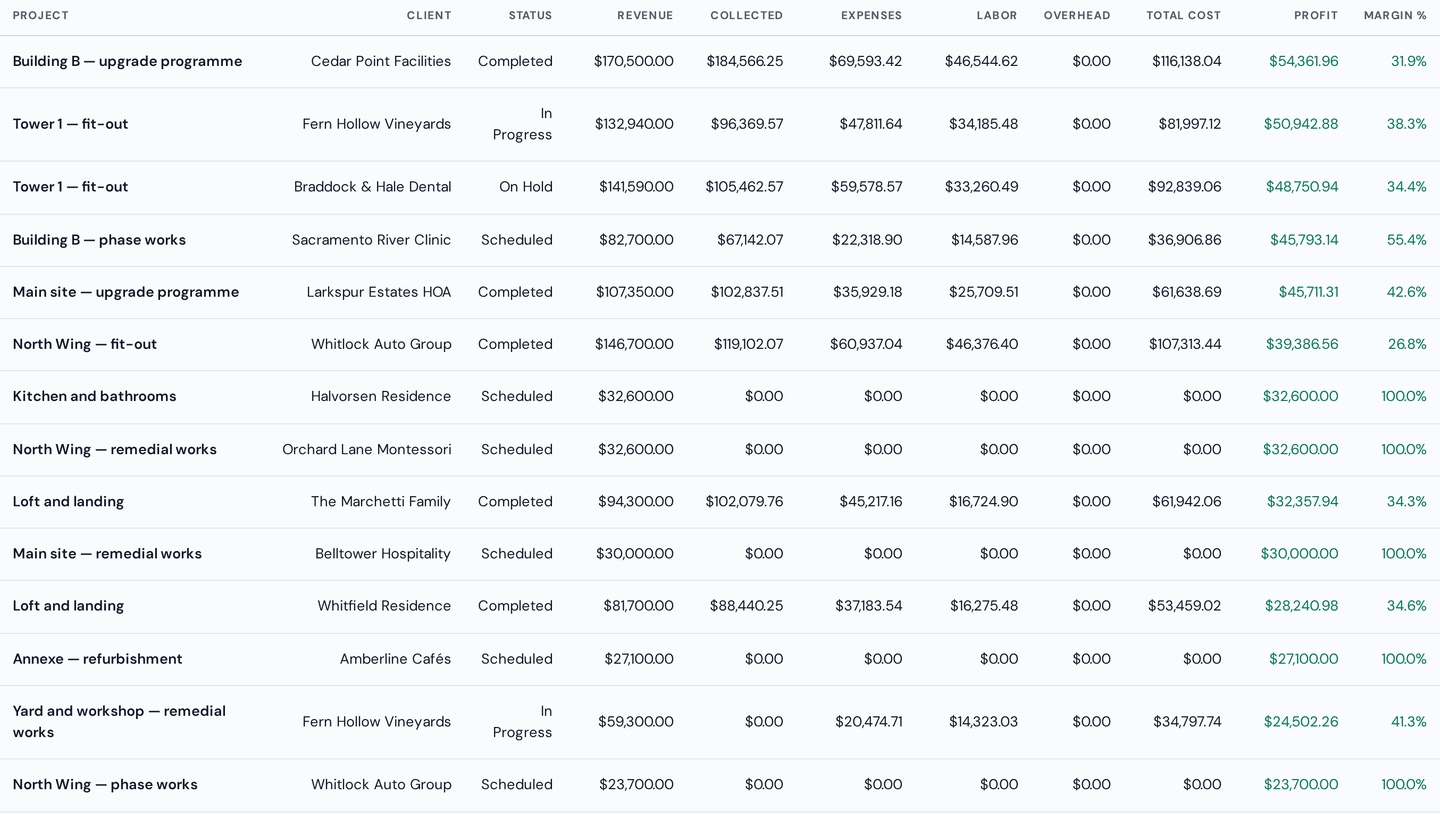

A real screen from the demo workspace, not a mock-up of one.
What makes it true
Three things most job costing misses.
Overheads land on the job
Insurance, the yard, the trucks, the phones. Spread across the work, so a job that looked profitable at 20% can tell you it was not.
Change orders carry their own money
Raised against the job, approved by the customer, and on the invoice, not remembered differently by two people in a corridor.
Crew hours are a cost, not a timesheet
Hours land against the job at what they cost you, the day they are entered.
See it on your own jobs.
Start with your next quote. There is no import to survive first.
Start a workspace, 60 days free